CMDB Dashboard
CSM provides a OOTB CMDB Dashboard that intuitively organizes your critical CI metrics into a single, real-time, at-a-glance CMDB control panel.
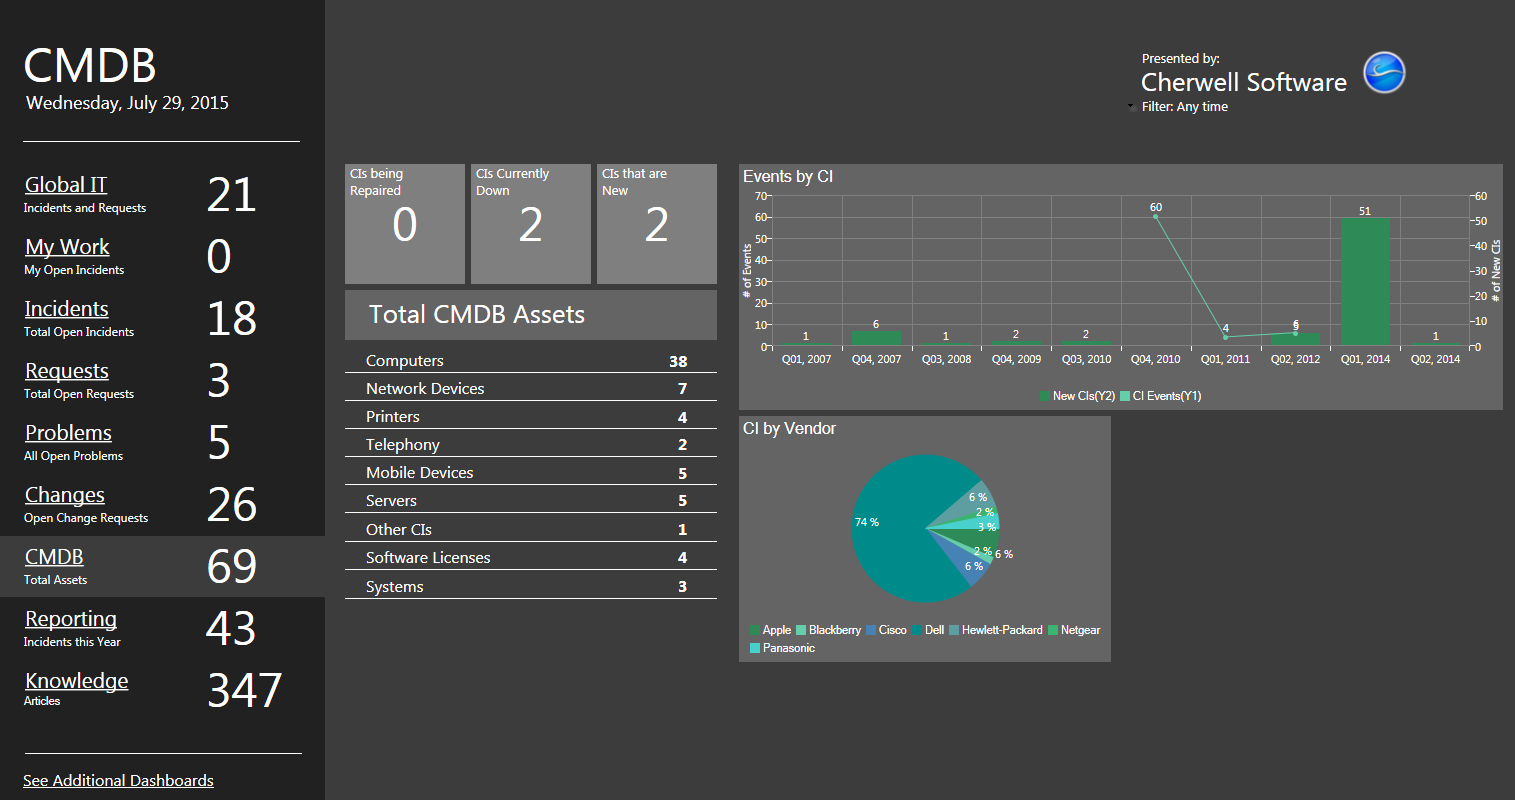
Note: CMDB metrics are also found on other OOTB Dashboards (ex: Global IT).
The following table describes the items on the Dashboard:
| Item | Description | Widget Type | Widget Name | Widget Uses: |
|---|---|---|---|---|
| CIs Being Repaired | Displays the number of CIs with an Asset Status of In Repair. | Text Gauge | CI in Repair | Custom Search Group |
| CIs Currently Down | Displays the number of CIs with an Asset Status of Down. | Text Gauge | Current Down CIs | CIs Currently Down Search Group |
| CIs that are New | Displays the number of CIs with an Asset Status of New. | Text Gauge | New CIs | Custom Search Group |
| Events by CI | Displays the number of Events by Vendor. | Bar with Line Chart | CI Events vs. New CIs | All Events Search Group, All Assets Search Group |
| CI by Vendor | Displays the percentage of CIs based on Vendor. | Pie Chart | CI by Vendor | Hardware with Manufacture Search Group |
| Total CMDB Assets | Displays the number of assets based on type. | Text Gauge | Uses the following Widgets:
|
Uses the following Search Groups:
|
| Filter | Filters Dashboard metrics by a defined date range. | Filter | CD - Date Filter - 30 Day Default |