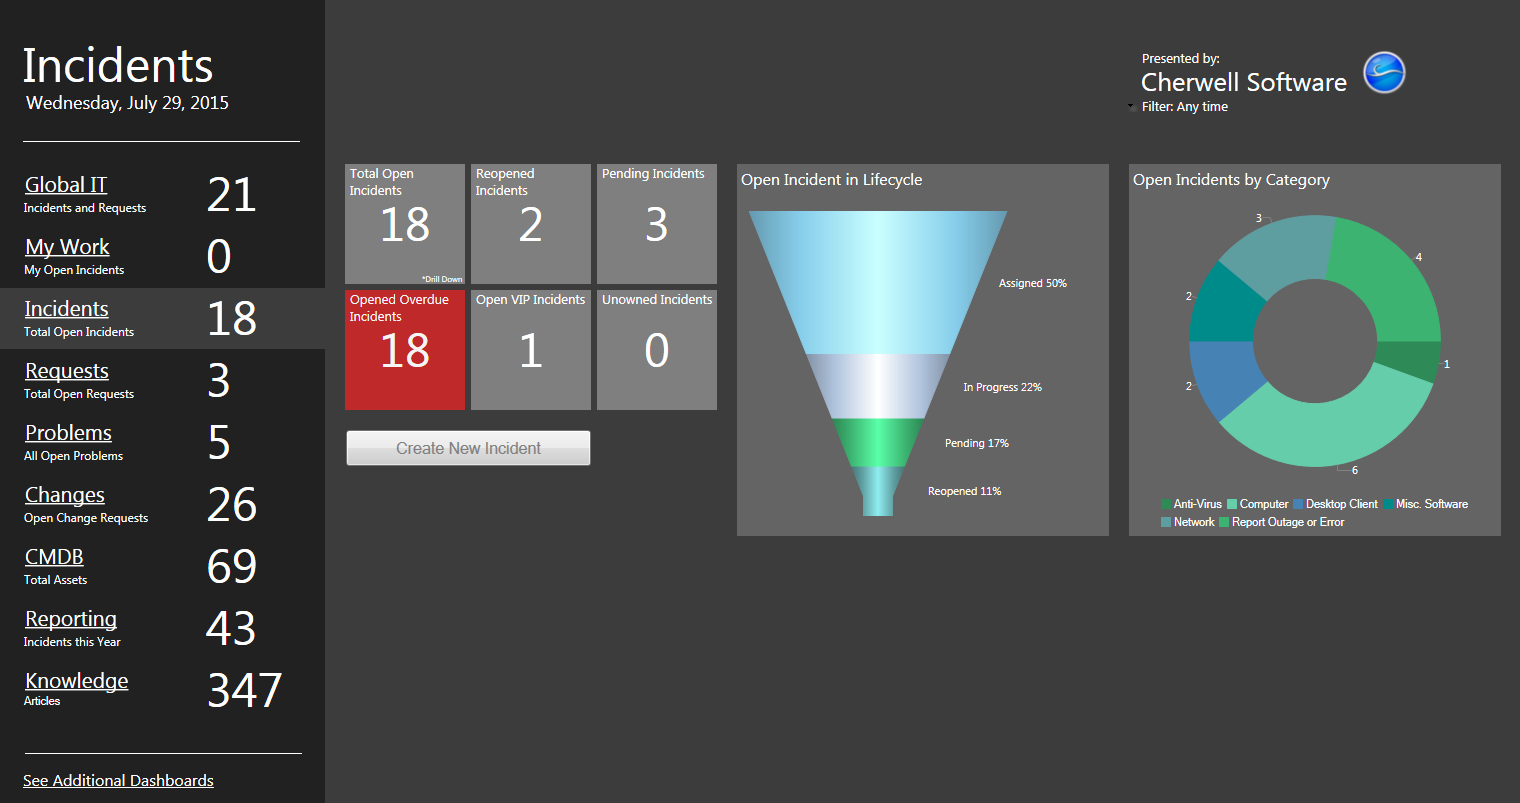
Incident Dashboard
CSM provides an OOTB Incident Dashboard that intuitively organizes your critical Incident metrics into a single, real-time, at-a-glance Incident control panel.
Note: Incidents metrics are also found on other OOTB Dashboards (ex: Global IT and Executive).
The following table describes the items on the Dashboard.
| Item | Description | Widget Type | Widget Name | Widget Uses: |
|---|---|---|---|---|
| Create New Incident | Creates a new Incident Record. | Button | NA | Create Business Object Action |
| Total Open Incidents | Number of Open Incidents (Status does NOT = Resolved or Closed). Drills down into the Incident Details Dashboard. | Text Gauge | Total Open Incidents | Open Incidents Search Group Incident Details Dashboard |
| Reopened Incidents | Number of Reopened Incidents (Status = Reopened). | Text Gauge | Total Reopened Incidents | Re-Opened Incidents Search Group |
| Pending Incidents | Number of Reopened Incidents (Status = Pending). | Text Gauge | Current Pending Incidents | Pending Incidents Search Group |
| Open Overdue Incidents | Number of Open Incidents (Status does NOT = Resolved or Closed) that have not been resolved by the SLA deadline. | Text Gauge | Current Overdue Incidents | Open Overdue Search Group |
| Open VIP Incidents | Number of Open Incidents (Status does NOT = Resolved or Closed) initiated by a VIP Customer. | Text Gauge | Total Open VIP Incidents | Total Open VIP Incidents Search Group |
| Unowned Incidents | Number of Open Incidents (Status does NOT = Resolved or Closed) that have an empty Ownership field. | Text Gauge | CDCurrent Unknown Incidents | Current Unknown Incidents Search Group |
| Open Incidents by Category | Percentage of Open Incidents (Status does NOT = Resolved or Closed) by Service Category. Pie slices represent Service Categories. | Pie Chart | Incidents by Category | Open Incident Search Group |
| Open Incident Lifecycle | Percentage of Open Incidents (Status does NOT = Resolved or Closed) by Status. Pipeline Slices represent Incident Statuses. | Pipeline Chart | Incident Lifecycle Distribution | Open Incident Search Group |
| Filter | Filters the data on the Dashboard by time (ex: Today, yesterday, within last week, etc.). | Filter | CD - Date Filter - 30 day default |