Stacked Bar/Column Charts
A Stacked Bar/Column Chart is a chart that stacks multiple data series on a single horizontal or vertical bar. The size of each data segment is determined by the series value plotted on a common (discrete) axis value. Use a stacked bar/column chart to compare amounts by category. Examples include:
- Number of Problems by Team stacked on common Date bars (example: Q1, Q2, Q3, and Q4).
- Number of Incidents by category stacked on common Date bars (April, May, June, etc.).
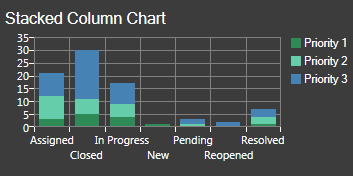
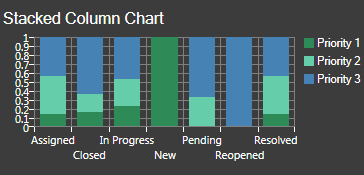
- Number of priority 1-3 Incidents stacked on common status bars (example: Assigned, Closed, In progress, etc.).
CSM provides two types of stacked bar/column charts:
- Stacked: Data segment is proportional to its value (therefore, stacks will likely appear staggered or uneven).
- Stacked 100: Data segments total 100% (therefore, all stacks will be
the same height).
Stacked Stacked 100
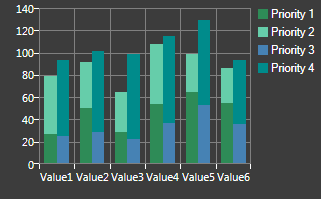
Multiple stacks are also supported. For example, you can stack series 1 and 2 on a common stack (stack group 1), and series 3 and 4 on another stack (stack group 2), if needed.
Good to Know:
- Column series can be stacked in any number of stacks at a single x-value.
- Column series, stacked or not, can still be combined with other series types (example: Line and scatter).
- Bar series can be stacked in any number of stacks at a single x-value.
- The stacking modes are Clustered (no stacking – default), Stacked, and Stacked100.
- Bars/Columns using the Stacked100 combine mode option must be associated with a y-axis such that all series associated with that axis use the Stacked100 combine mode.
- Formulas cannot apply to stacked series. Because the origin of the stacked points are not at the x-axis, stacked series points are not drawn at their actual Cartesian coordinates.
- When a series is grouped, all resulting series use the combine mode as specified for the original series. For example, if you define a single series as stacked, all the series resulting from the grouping will be stacked in the same group.
- Stacking is not supported for a continuous numeric x-axis (column and bar). No combine mode options will be shown for that scenario.
- Point labels will not be shown for stacked points, but will continue to be shown for clustered points.