Dashboards
Use a Dashboard to monitor critical metrics, analyze and predict trends, drill-down into data, initiate commands and actions, or display information that might be relevant to a group of Users/Customers.
Example Dashboards include:
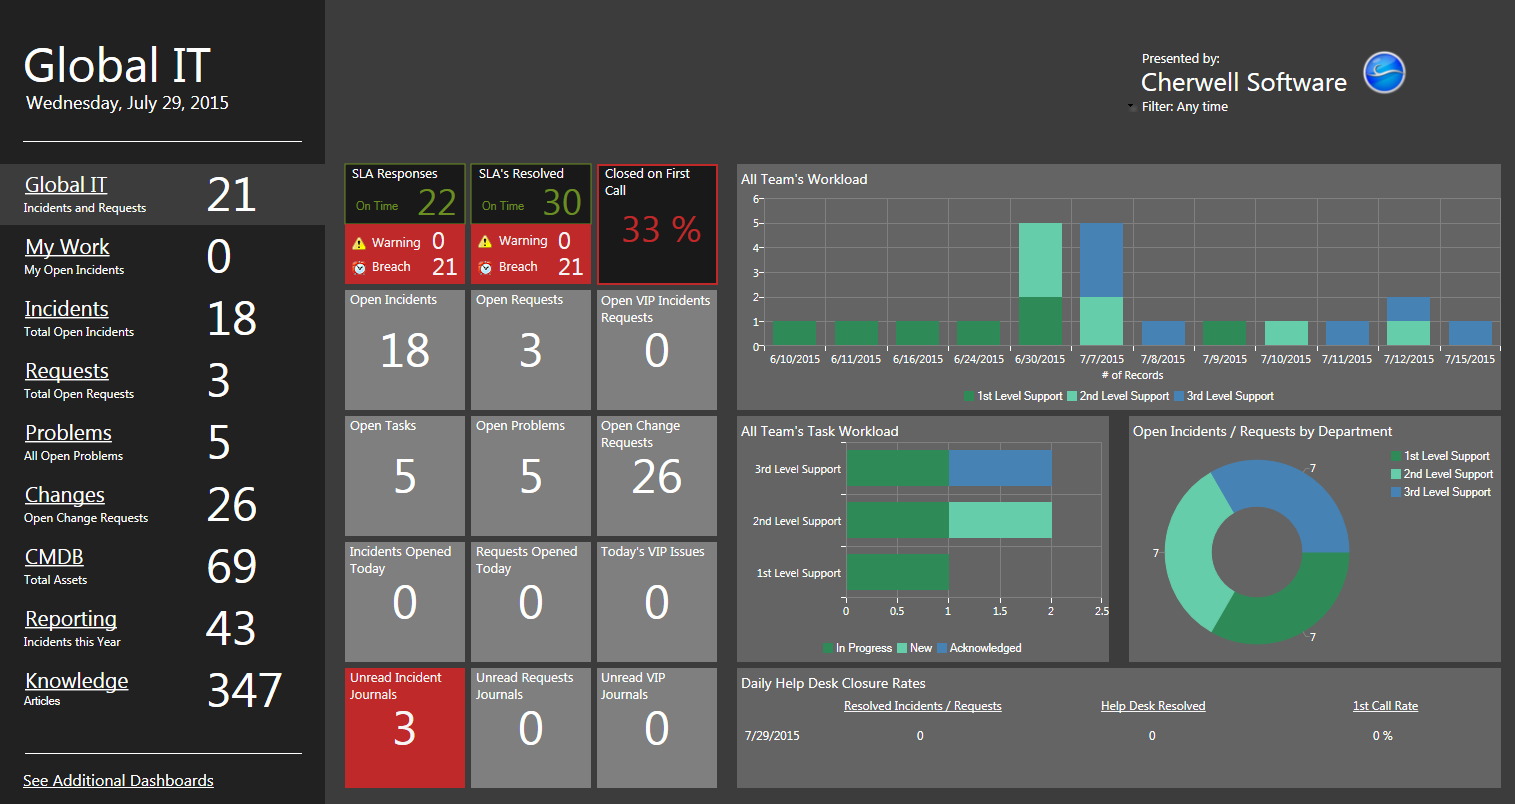
- A Global IT Dashboard: Presents critical Business Object data and analytics (ex: Open Incidents and Tasks, team workloads, closure rates, etc.).
- Business Object Dashboards: Intuitively organize critical Business Object data and analytics into real-time, at-a-glance control panels (ex: Incident Dashboard, Knowledge Article Dashboard, CMDB Dashboard, etc.).
- A Personal Dashboard: Presents personal data and analytics (ex: Incidents and Tasks owned by you or your Team, status, etc.).
- Portal Dashboards: Designed specifically for the Customer Portal to provide Customer-specific at-a-glance information and navigation functionality, such as links to helpful self-service Actions (ex: Report an Incident, search Knowledge Articles and FAQs, etc.), a community discussion board, a list of open records (ex: (Incidents and Problems), contact hours, etc). For more information, refer to Portal Dashboards.
- Simplified Mobile Dashboards: Designed specifically for Cherwell Mobile to provide simple, at-a glance information and navigation functionality to Users accessing CSM on a mobile device. For more information, refer to the Mobile Dashboards documentation.
The following figure shows an example Dashboard with several different types of Widgets. A Theme controls the fonts, colors, and styles of the Dashboard and its Widgets, and gives the Dashboard a cohesive look. Configurable filtering, drill-down, and refresh capabilities allow you to view information when and how you want.
Each User has a designated default:
- Home Dashboard: Opens when you first log in or when the Home button
 is clicked on the
CSM Desktop toolbar or Browser Client menu bar.
is clicked on the
CSM Desktop toolbar or Browser Client menu bar.
- Heads-Up Display (HUD): Pops up a transparent Dashboard that can be accessed from anywhere in the application when you press F4.
- Dashboard Theme: Colors, styles, and fonts to give the Dashboard a cohesive look and feel.
The default Dashboards (Home and HUD) and Dashboard Theme are initially selected in CSM Administrator, either Globally or by Role. If a User has security rights, she can select her own User default Dashboards and Dashboard Theme in the CSM Desktop Client. Access available Dashboards using the Dashboard Manager.
CSM provides several OOTB Dashboards, designed to help facilitate common service desk operations. Use these OOTB Dashboards as-is, edit them, or create your own using the Dashboard Manager and the Dashboard Editor.