Visualizations
CSM provides several OOTB Visualizations to represent Relationship data, or create a Visualization to represent your custom CSM configuration.
Use Visualizations to graphically view any type of Relationship in CSM, including:
- Relationships between Configuration Items (CIs) to assess potential risks for an Incident or Change.
- Relationships between personnel (example: Executive, manager, technician).
- Relationships between Service Level Agreements (SLAs), Operational Level Agreements (OLAs), Configuration Items, Underpinning Contracts, and Services.
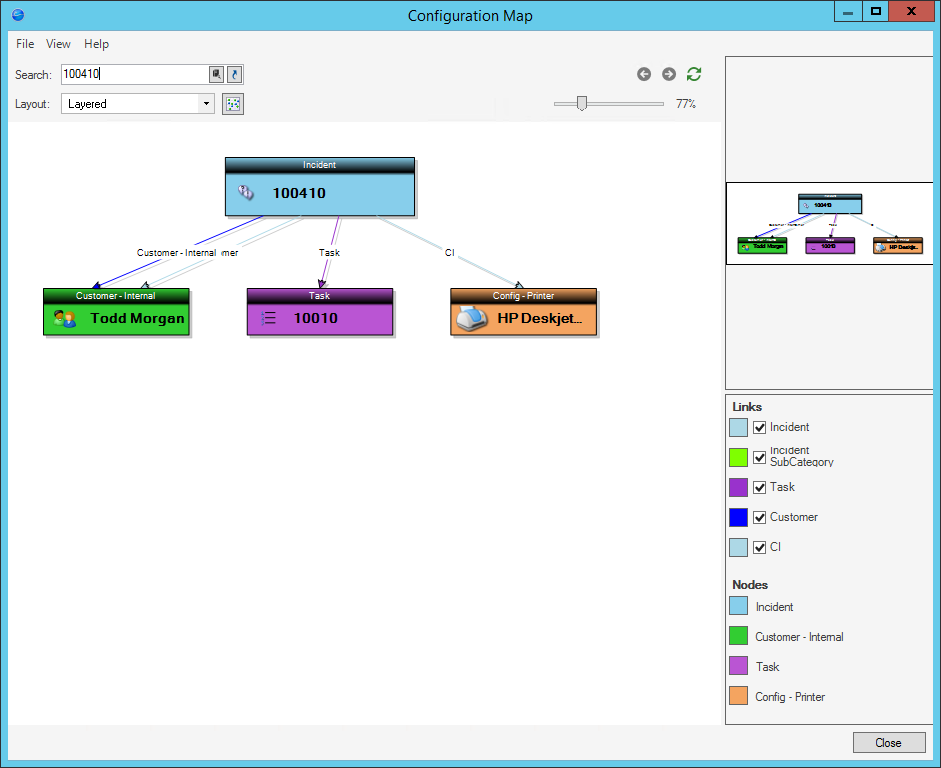
The following example Visualization is a Configuration Map that shows relational data for an Incident:
Some possible uses of Visualizations include:
- Configuration map.
- Organizational chart.
- Change sources (Incidents and Problems that feed a Change).
There are a number of different ways that Visualizations can be laid out in order to show data appropriately. Also, if an object is in an alert state (example: If a server is down), the object node can be configured to appear in a different color.
Each User has a designated default Visualization, which displays when the User presses SHIFT+F7 from the Desktop Client. The default Config Visualization is initially selected in CSM Administrator, Globally or by Role. Access available Visualizations using the Visualization Manager.
Visualizations can be exported into PDF, SVG, or Viso (.vsdx) files.