Create a Chart Widget
Use the Chart Widget Properties window (accessed from within the Widget Manager) to create a Chart Widget.
To create a Chart Widget:
- Create a Widget.
- In the Type drop-down, select
Chart.
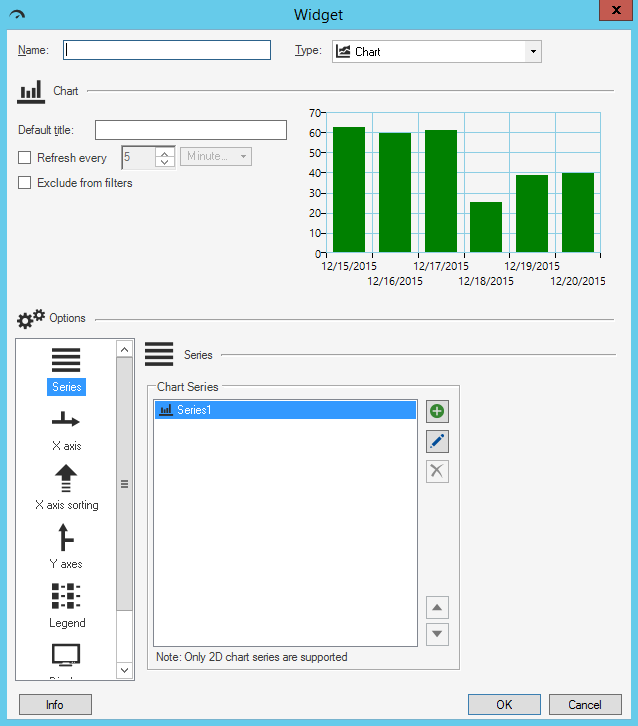
- Define the following properties:
- General: Default title, refresh, and exclude from filter properties.
- Series: Define one or multiple data series to display in the Chart Widget, and the properties for each series.
- X-Axis: How the x-axis looks and behaves (ex: Value type and units, and label, indexing, and value display options).
- X-Axis Sorting: How x-axis values are sorted (ex: By type, label, query, Lookup Table, etc.).
- Y-Axes: How one or more y-axes look and behave (ex: Labels and scale; the scale can be calculated or fixed).
- Legends: How the legend looks and behaves (ex: Visibility, docking, and alignment).
- Display: How the chart itself looks and behaves (ex: Items to show, color palette, animation, and Dashboard Theme color/style overrides.